
Spring Boot Actuator is a powerful tool that comes bundled with Spring Boot applications. It gives you production-ready features, like application health check monitoring, incoming traffic, database running state, and gathering metrics (usage of core processors, heap memory, threads, loaded/unloaded classes, and thread pooling).
In this blog, we will learn in detail about how to enable the Spring Boot actuator to your application.
Enabling Spring Boot Actuator is a straightforward process and can be done in several ways, depending on your preference and project setup:
Let’s first create a Spring Boot project using start.spring.io

You can add dependency manually in your existing project like this:
Maven dependency
We can enable the actuator by injecting the pom.xml file.
<dependency>
<groupid>org.springframework.boot<groupid>
<artifactid>spring-boot-starter-actuator</artifactid>
</dependency>
Gradle Dependency
Or, we can do it by injecting the gradle file.
compile group: ‘org.springframework.boot’, name:’spring-boot-starter-actuator’
Run the following command in your project’s terminal root directory.
mvn spring-boot:run
NOTE: By default, It runs on port 8080. We can override settings by configuring the application.properties file.
management.server.port=8080
Actuator, by default, generates so-called endpoints that can be exposed over HTTP or HTTPs or JMX to let your application monitor.
Most applications reveal endpoints through HTTP, where the ID of the endpoint close by a prefix of /actuator is intended for a URL. For example, Normally, the health endpoint is intended for/actuator/health.
By default, Only the /health endpoint is accessible via HTTP. That’s why the /actuator page lists only the health endpoint.
Here, we’ll shortly figure out how to expose other actuator’s endpoints.

Enabling Common Actuator Endpoints
/health Endpoint
This endpoint shows the status of the application as follows:
{
“status”: “UP“
}
The status will be UP as long as the application is in a healthy state. It will start showing DOWN as it gets any database connectivity issues or lack of disk space.
Also, check the health of your application by combining several health indicators.
Spring Boot actuator comes with different pre-defined health indicators. i.e. DataSourceHealthIndicator, RedisHealthIndicator, DiskSpaceHealthIndicator etc. It uses these health indicators as a part of the health check-up process.
We can enable/disable particular health indicators by using the following property.
management.health.redis.enabled = false
NOTE: By default, all health indicators are enabled and take part in the health check-up process.
Displaying Detailed Health Information
Default Health Endpoint shows only UP or DOWN status. In order to get the complete status of every health indicator that took part in the health check-up process.
management.endpoint.health.show-details =true
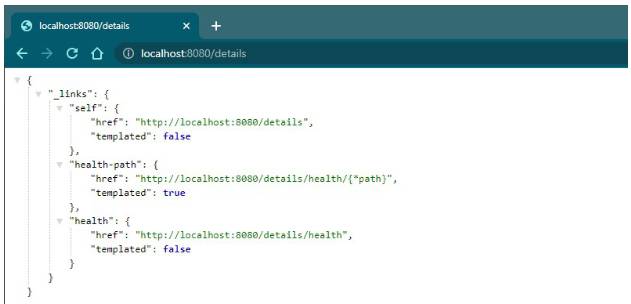
Configure Custom Path
By default, /actuator is the endpoint to trace health indicators. We can also customize paths by using the following property in the application.properties file.
management.endpoints.web.base-path=details
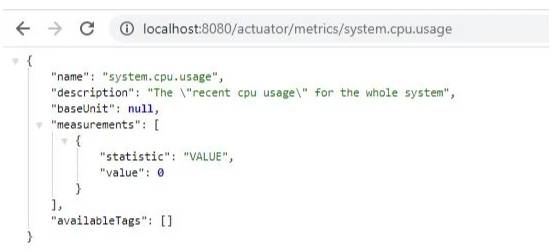
/metrics Endpoint
This endpoint lists all the metrics that can be tracked. For example, system.cpu.usage, jvm.memory.max, etc.

In order to get the details of a specific metric, we need to pass only the metric name with the following URL.
http://localhost:8080/actuator/metrics/{metric_name}
For example, use the following URL to get the details of system.cpu.usage metric.
http://localhost:8080/actuator/metrics/system.cpu.usage
Below is the output of the above endpoint.
There are a few different endpoints that you can also check, for example:
| Endpoint ID | Description |
| catches | It shows accessible caches |
| loggers | It provides a list of all the configured log levels for each of your application’s configured loggers. |
| mappings | Lists down all the @RequestMapping paths. |
| sessions | Allows deletion and reterival of user sessions from Spring Session-backend session store. |
| beans | It lists down all the Spring beans in your application. |
| env | To see the list of environment variables used in our application. |
Enabling Spring Boot Actuator in your application can provide valuable insights into its performance and health. By following the steps outlined above, you can easily enable the actuator and access powerful features like monitoring endpoints, detailed health information, and tracking metrics.
USA408 365 4638
1301 Shoreway Road, Suite 160,
Belmont, CA 94002

COMMENTS ()
Tweet